What is this?
When I first started working, I didn't have dataloggers or any way of monitoring some of the spaces where we were storing collections. I also don't have an HVAC system or any sort of automatic or even semi-automatic way of controlling the environment in spaces. All control requires a person turning something on or off, opening or closing a door, etc.
I needed to make decisions about placement of shelves, furniture, collections and dehumidifiers, but I didn't really know what was going on in these spaces. A datalogger could tell me general information, but I needed detailed knowledge about different areas within the same space, so I came up with a simple environmental monitoring solution that can be applied when you have no budget at all.
Why this model works for me
I have run this model 3 times. Once in 2016, and twice in 2017 - in the summer and in the fall. I believe I should probably run it a few more times in different weather conditions to see how things change over the changing seasons in the year. It will not look the same throughout. However, knowing how the humidity looks in my spaces has helped me decide on where to place my dehumidifiers and what to do about opening and closing doors at different times of the year.
Keep in mind that this is a basic modeling tool I came up with. It may not necessarily work for you. It might not be worth doing if you have more sophisticated systems for monitoring and controlling the environment. However, if you ever find yourself in a situation similar to mine, let me know if you tried it out and if it worked for you!
What you need
- A small step ladder (to take the higher readings)
- A handheld thermohygrometer
- A bit of time to take your measurements. It does take a while if you do a lot of spaces.
- Microsoft Excel
- This template if you don't feel like making your own from scratch. You can mess with it however you wish for your own personal use, but please download it first. Don't change the original.
Obviously, this method will be hindered by unmoveable furniture in your way depending on how your spaces are set out, but you can probably figure out if this is still possible working around the obstacles.
The basic concept
The idea behind this model is extremely simple.

Figure our your space and divide it into a grid. The more measurements you take, the more detailed your final model will be. Be aware that less than 9 grids will not give very satisfactory results. I know from personal experience that just four or five points (corners and centre) does not work at all.
- Map out your space. To make it easier, think of it as a square. Naturally, if your space is rectangular, use a rectangle and more grids. Know the location of your doors or other openings such as ventilation systems or windows to help you with later interpretation.
- Take temperature and relative humidity measurements at 3 different heights (ground level, 1m/3ft and 2m/6ft off the ground) at each different grid of your space. If you have really high ceilings, you might have to take more measurements heightwise. Make sure you step away from your sensors while the measurement is being made so your breathing and body temperature do not affect it and that you have a standardised way of taking the measurements. For example, waiting x number of seconds before reading or resetting the equipment in between reads. Note: I have mapped temperatures too but the variations were so small, they didn't really give a useful model for me, so unless you're particularly concerned about temperature, it might not be worth doing a model for that.
- Turn the information you get into a 3D surface chart in Excel.
Making your 3D surface charts in Excel
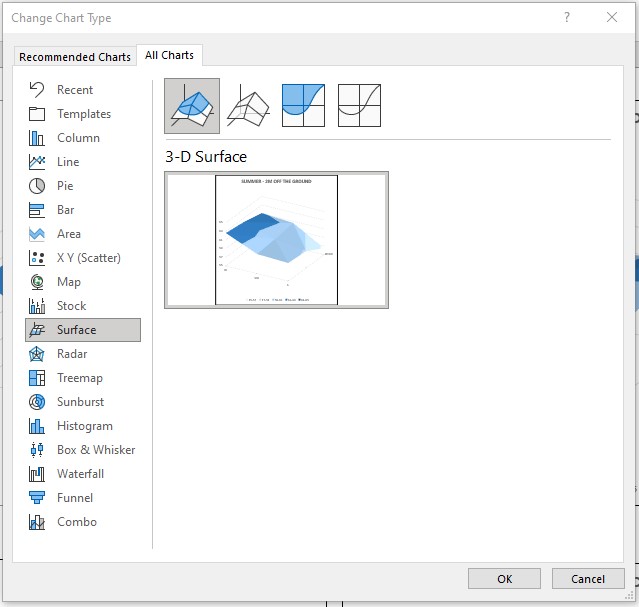
Screenshot of 3D surface charts in Excel. This is the one you will have to use, although you can play around with the contour or 2D versions if you prefer.
1
Copy over your data into an Excel table that replicates the room grid you made. Make a table for each height level. I am using metres.
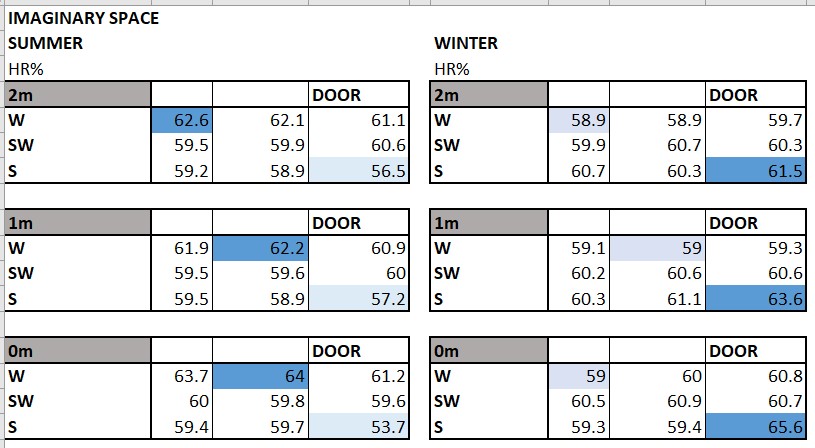
Excel tables replicating the spaces measured. Note that I have coloured in the wettest and driest numbers for my own benefit.
I am using the cardinal points to name the different areas in the room. I have also pointed out where the door is. You can basically equate these tables to the square of the grid you made.
Important: Please note that when the graph gets drawn, the column names at the top of your tables will actually show up at the bottom of your graph as the X-axis, so don't put the names of the top locations on those columns. This is why I have left them empty. If you don't think it will confuse you, you can put the names of the bottom locations of your room in the names of the columns.
2
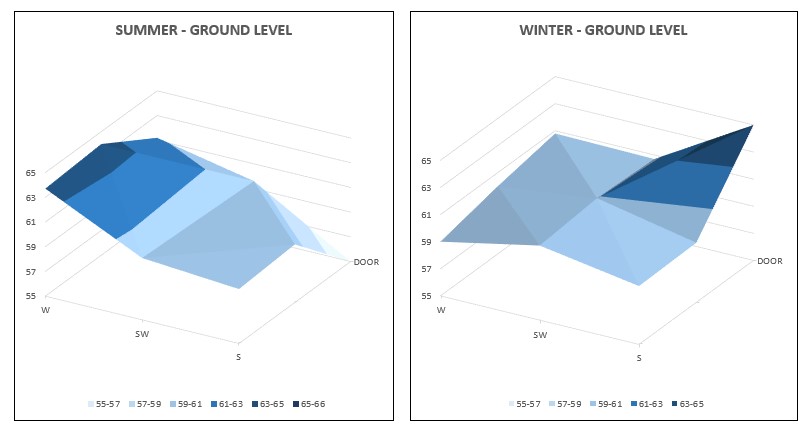
Organise your graphs so that you can see the highest at the top and the ground level at the bottom.
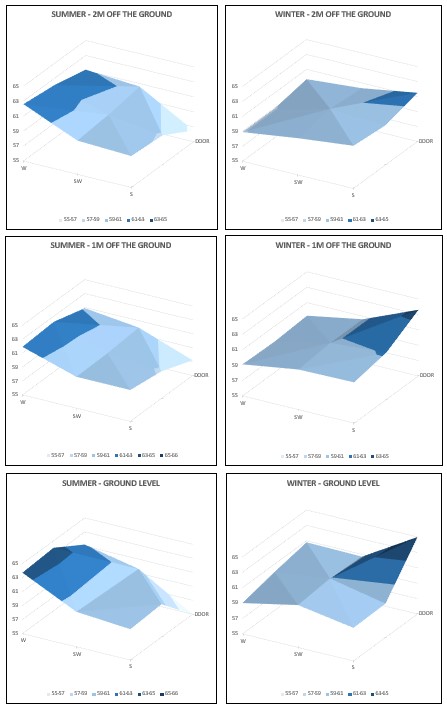
3D surface chart results in Excel. Make sure that you colour code your graph consistently and that you are using the same axis formatting so that you can compare across graphs.
3
Interpret your data and make your decisions.
Some of the things you can see in the above results for an imaginary space are:
- In the winter, humidity seems to be coming in through the door and is highest at ground level.
- In the summer, for some reason, the NW corner of this room is quite humid, particularly at ground level.
Decisions you can make based on this:
- Close the door in the winter
- Place dehumidifiers in the NW corner in the summer and near the door in the winter. Try to find out why that corner is more humid than the rest of the room, so you can take action.
- Avoid placing humidity-sensitive objects close to the ground.
Pros and Cons
- These are not fool-proof graphs, nor are they comprehensive. It is best if you do the exercise several times at different times of the year to refine your results.
- Obviously, you are missing out on areas where you didn't take measurements.
- The graph does not cover the whole space seamlessly.
However
- The graphs can still give you a rough visual guide for what's going on in a space regarding relative humidity and will enable you to rethink your decisions coming from a place of at least some knowledge rather than just educated guesses.
If you liked this post, you can follow me on Twitter where I'll be posting more content on conservation tidbits and how to improve your collections at home.