Photo by Julia Filirovska on Pexels.
Contents
- Dew point
- Absolute vs. Relative humidity
- The psychrometric chart explained
- Let's go back to dew point
- Useful links
Dew point
What is the dew point, in simple terms? When you look at your environmental monitoring charts, you are used to seeing the temperature and relative humidity lines. However, there is also another line. The dew point line, and this line can be a bit trickier to interpret.
What does it tell us? I have found several explanations of dew point, so I will attempt to sum it up here as clearly as possible:
- Dew point is read as a temperature. You will see it in °F or °C.
- It represents the absolute moisture content of the air.
- Dew point is the temperature at which Relative Humidity (RH) in your space is at 100% so that the moisture will start condensing out of the air.
- This means that the dew point is the temperature at which dew will begin forming in your space.
- If your dew point temperature is close to your dry air temperature, your RH is high.
- If your dew point is well below the dry air temperature, your RH is low.
- In other words, it is not something you want to be too close to your dry air temperature if you want to keep your things dry.
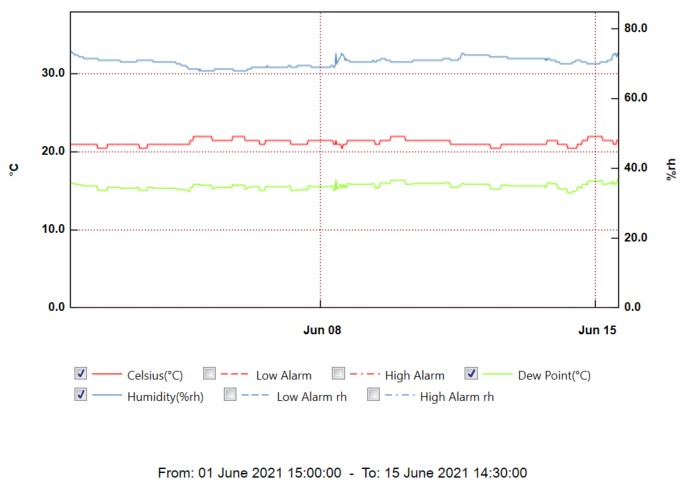
This is a space without any HVAC control. There is no artificial humidifying or dehumidifying or heating or cooling. If you look closely, you will notice that the dew point line is basically the same as the temperature but a few degrees below it.
Absolute vs. Relative humidity
Before going a bit more into dew point, it's important we understand two concepts clearly. You will find much better, more scientific definitions in physics sites, but the following are supposed to be straightforward and clear.
Absolute humidity
- Assuming constant atmospheric pressure, absolute humidity is the actual amount of water (in weight) that can be "held" by air at a particular temperature. It's actually more about vapour pressure equilibrium, but let's not overcomplicate for now and use the word "hold".
- It is expressed as weight of water per weight or volume of air. So it can be in grams of water per kilograms of dry air. Or grams of water per cubic metre of air. Or similar measurements using feet and pounds.
Relative humidity
- Relative humidity is that amount of water expressed as a percentage of the total amount of water that can be "held" by air at that same particular temperature and pressure.
- It is expressed as a percentage.
Example in an imaginary space
| Absolute humidity in g/m3 | Temperature in °C | Relative humidity % |
|---|---|---|
| 5 | 10 | 53.2 |
| 5 | 20 | 28.9 |
| 5 | 30 | 16.5 |
Numbers calculated using Michell instruments calculator
If you look at the above example, you can see that in an imaginary space that holds 5g of water per cubic metre of air, the relative humidity will vary depending on the temperature even though the amount of water in the space has not changed.
This helps explain how, if the only thing you can control is temperature, you can lower it to increase humidity, or increase it to lower humidity. There is an inverse relationship.
The psychrometric chart explained
The psychrometric chart is a really intimidating looking graph with a ton of lines going in 6 different directions. For the sake of clarity and because conservators don't really need to use them, I have not drawn in the enthalpy or volume lines. Let's leave those to the engineers and HVAC specialists. Don't worry about the actual numbers in the following charts. These are not strictly accurate charts, but are only being used diagramatically.
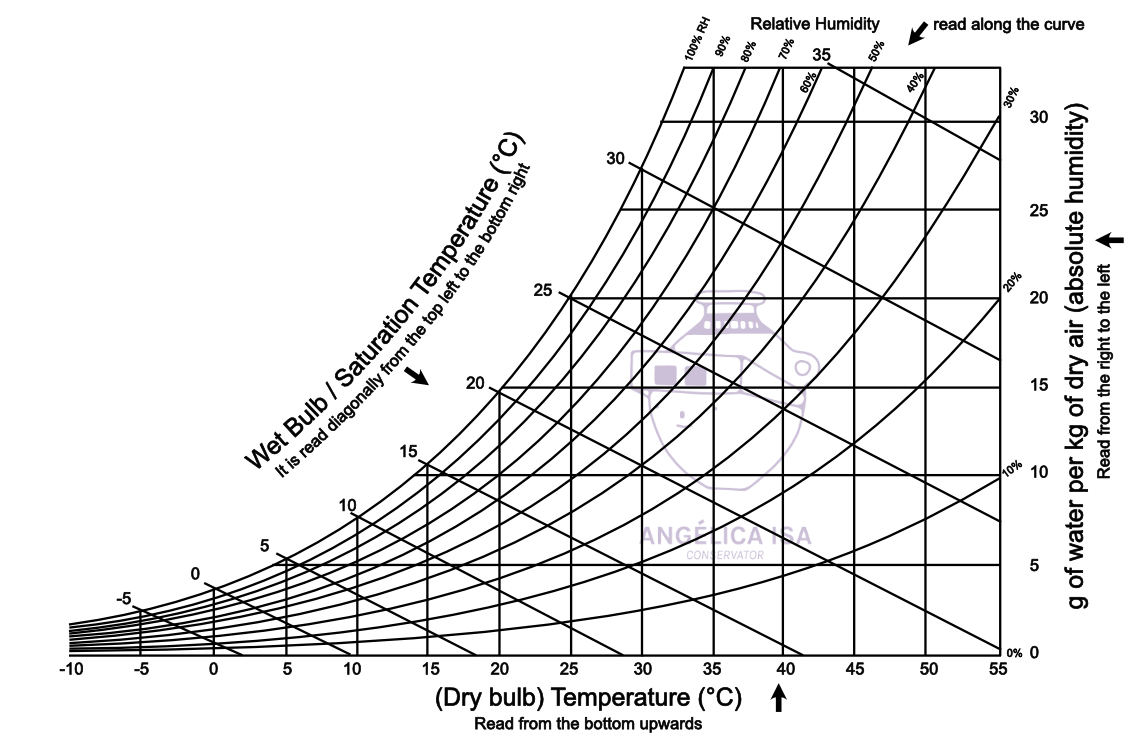
Look at all those crazy lines. Notice that there are temperatures, absolute humidity and relative humidity in there. But which is which and going where and what is this and what do we do with it?
Before we begin parsing this out, the answer to your question is YES.
What is your question? Probably
Isn't there an online calculator for this horrible thing instead? YES
You can use the Mitchell humidity calculator that I linked above with the table, or you can use the Image Permanence Institute Dew Point Calculator, which I link below in the links. That said, you might not always have access to the internet (Crazy! I know!), so why not understand the vintage way of going about it?
Let's separate things line by line...
Dry bulb temperature
The dry bulb temperature is the fancy way of saying what we normal people mean by temperature. It is the x-axis at the bottom of the graph and will be seen going upwards. You could also say it is read from left to right in the sense that the lines are vertical but going left to right.
Wet bulb temperature
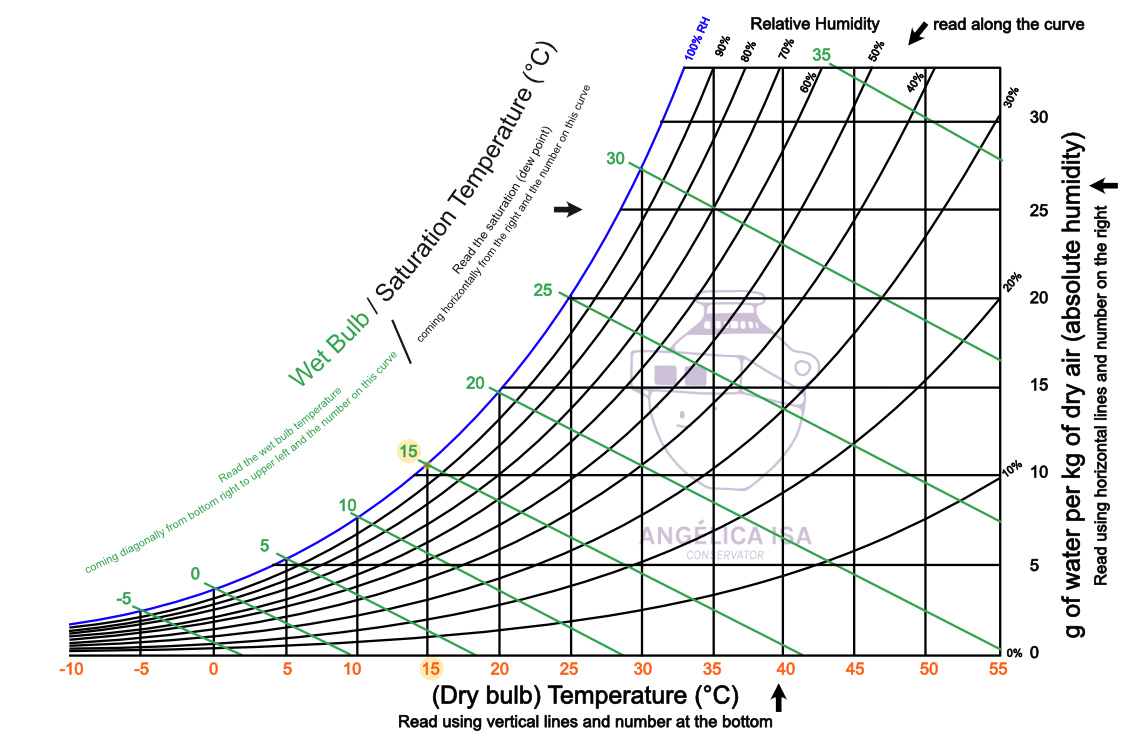
The wet bulb temperature is traditionally measured by using a thermometer with a water-soaked cloth around it. The temperature you get will be affected by the evaporation of water from the cloth. If you have 100% relative humidity (blue), the wet bulb temperature (green) will be the same as the dry bulb temperature (orange) because they will both be essentally surrounded by water (Notice the 15°C I have marked for you in light yellow). To get a wet bulb temperature reading, either your manual thermohygrometer has to be digitally setup to tell you the wet bulb temperature, or you will have to use one of these old-style whirling hygrometers that have two thermometers in them. These readings have diagonal (green) lines that cross towards the bottom right and use the (blue) 100% RH line as the base axis.
Relative humidity

The relative humidity in a psychrometric chart can be found as curling curves that get wider as they go from the bottom left towards the top right of the chart. It's very easy to tell it apart from the other readings because it's a percentage number.
Absolute humidity
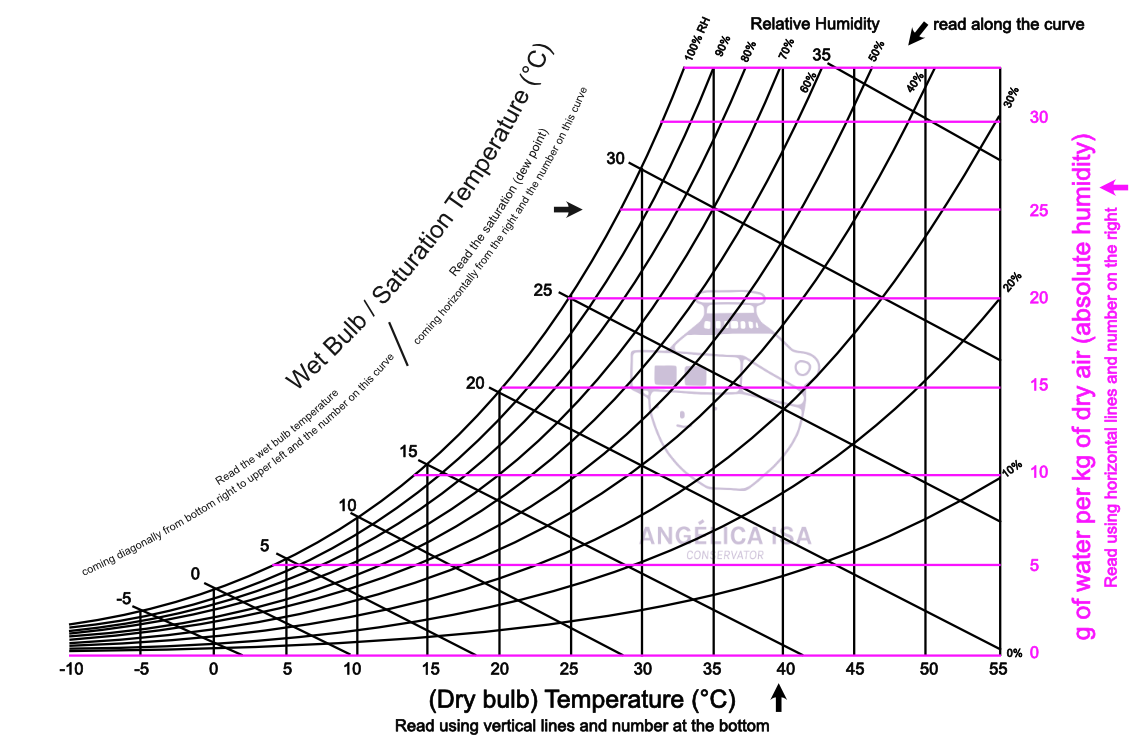
Absolute humidity will be running as the y-axis on the right of the chart and will have to be read using the pink numbers on the right axis. Absolute humidity rfers to the amount of water being "held" in your air.
Dew point or saturation temperature
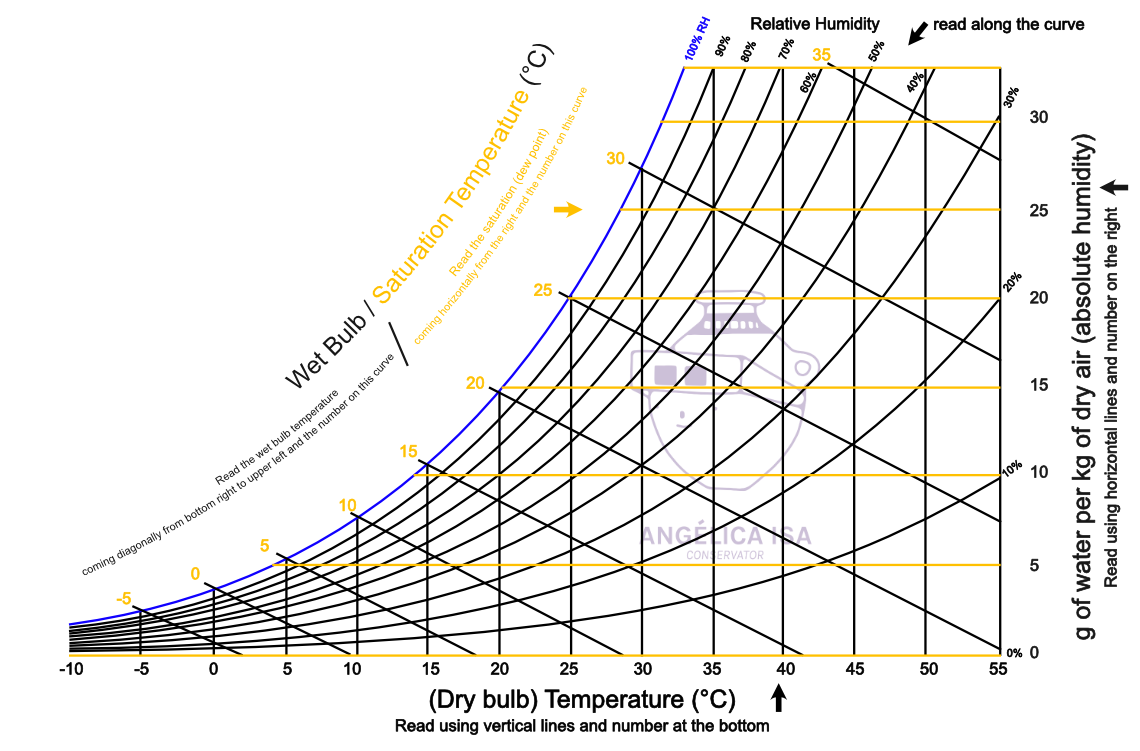
The dew point will be read by moving horizontally (yellow) using the same lines as if you were reading absolute humidity (pink), but the number readings will use the (blue) 100% RH curve line as the base axis, just like with the wet bulb temperature (green). This does not mean that wet bulb temperature and dew point (also called saturation temperature) are the same number (they are not), they are just sharing the same 100% RH curve for readings. Go back to the wet bulb graph above and compare it with this image if you need to. The wet bulb (green) temperature is read diagonally while the dew point (yellow) temperature is read horizontally.
A quick note on dew point vs. wet bulb
Just in case all this talking about absolute humidity, relative humidity, dew points, wet and dry bulbs confused you. Here is a quick table to explain the difference between the wet bulb and the dew point.
| Dew point temperature | Wet bulb temperature | |
|---|---|---|
| Definition | Temperature at which Relative Humidity (RH) in your space is at 100% so that the moisture will start condensing out of the air. | Temperature you get from a moistened thermometer bulb exposed to air flow. Affected by the evaporation of the water. |
| At high RH | Close to dry bulb temperature | At 100% RH, it equals dry bulb temperature. Notice that at 100% in the graph below, the blue and green lines meet. |
| At low RH | Below dry bulb temperature. At 10%RH, your dew point will be around 5°C. Read along the 100% blue line at the blue 10% level. | Low. See graph below. At 10%RH your green wet bulb will be about 20°C while your orange dry will be around 43°C. |
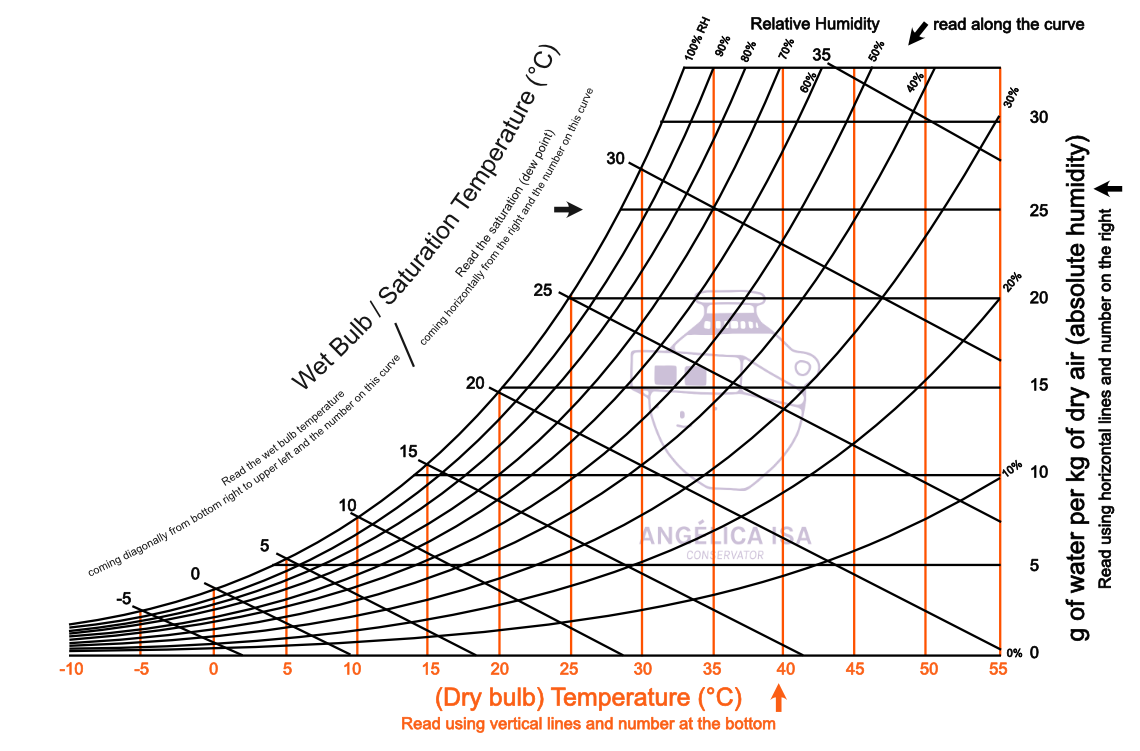
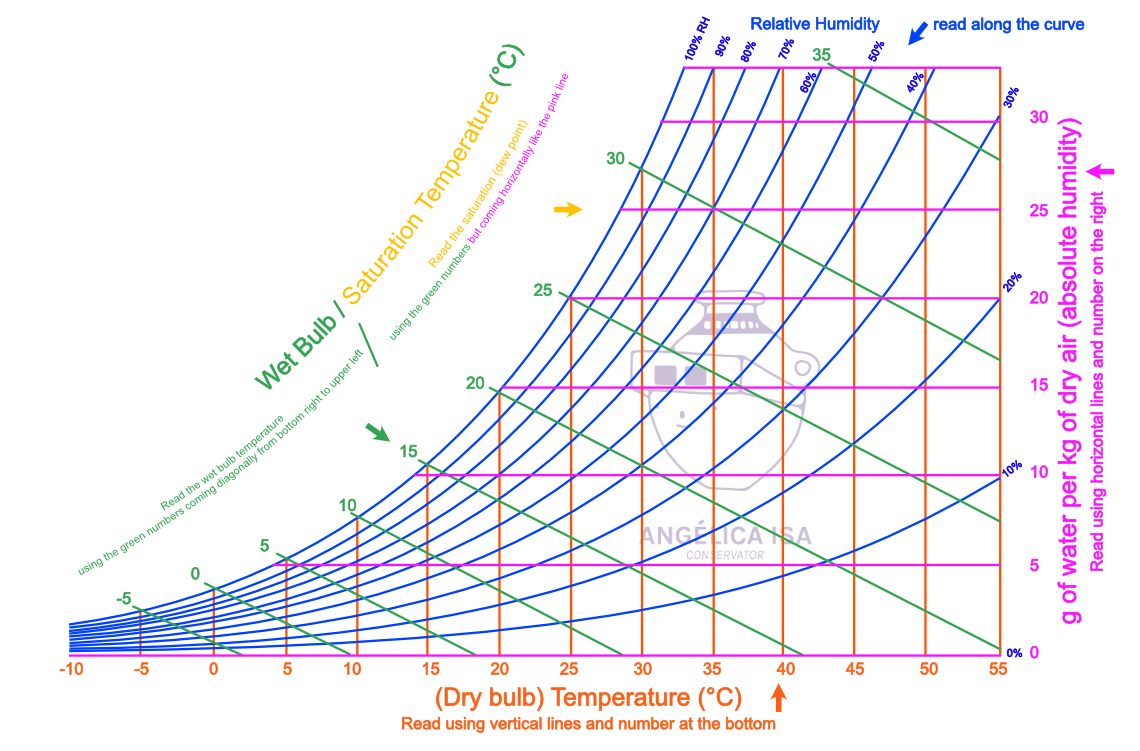
The psychrometric chart again in full colour
Now that you have seen all the lines coloured in one by one, this psychedelic graph should be less shocking. Hopefully, it is also much less intimidating than the original one where all the lines were black.
A psychrometric chart and dew point example
Why did we go through all that? The point of the psychrometric chart is that you should be able to get any of the variables as long as you have at least two other variables that you can cross-reference in the graph.
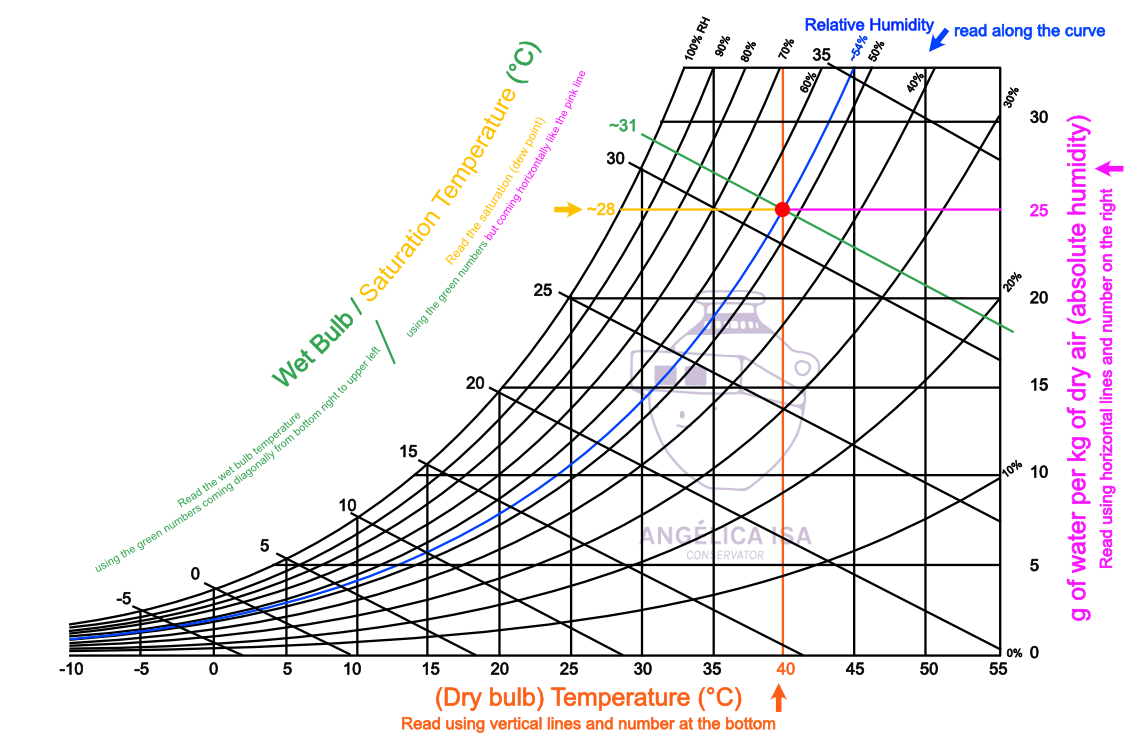
Let's take a look at this example. Imagine you measure a space with (orange) 40°C and (blue) 54% relative humidity. Unpleasant, I know. But just look at the numbers. Using the chart, you can find the place where the orange 40°C dry bulb and the blue 54% RH intersect (red dot). This will tell you that your space has (pink) 25g of water per kg of dry air. If you move your eyes horizontally to the left and read along the 100% RH line, this means your dew point is ~28°C (yellow). Should you require it, look at the diagonal green line, and you will tell that your (gren) wet bulb temperature is 31°C.
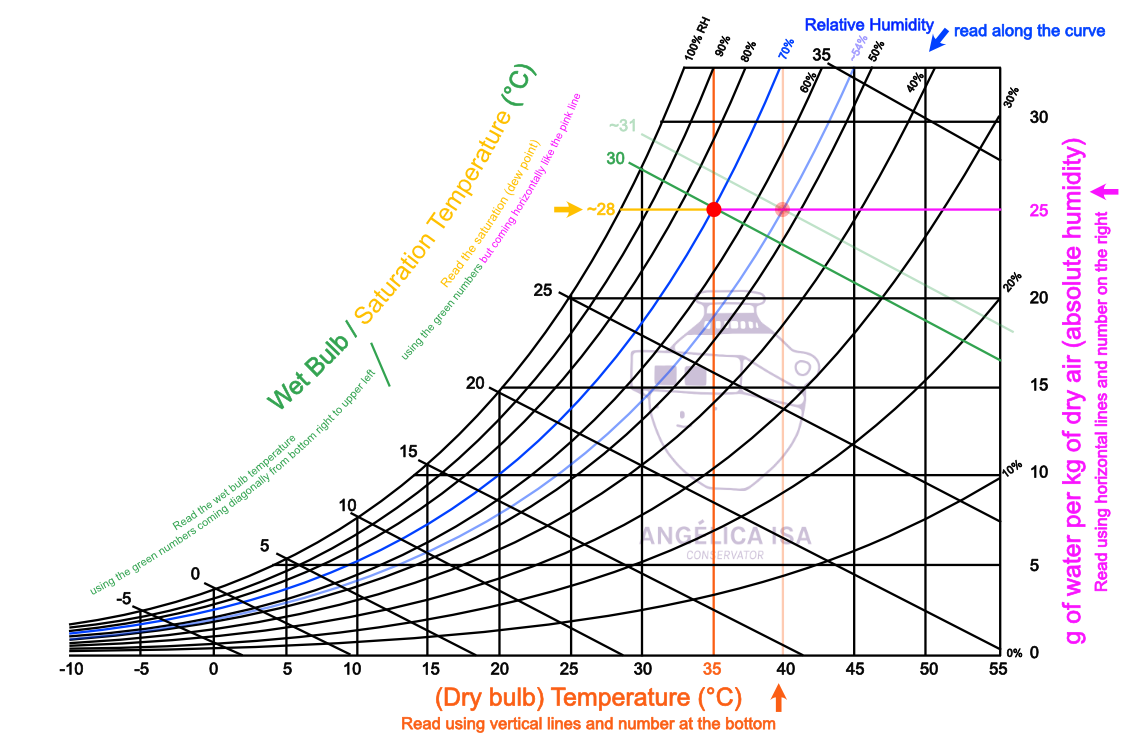
Now imagine that you don't have any dehumidifiers or humidifiers, but you manage to lower the temperature to 35°C. If you look at your graph now, your (green) wet bulb temperature has moved down to 30°C. You should still have 25g of water per kg of dry air, but now you have about 70% RH (blue). Notice your dew point has not moved because the amount of water (pink) has not changed and this number is read horizontally. It is still at ~28°C (yellow).
What can the psychrometric chart do for you?
Once you become comfortable reading a psychrometric chart and following the lines in the correct directions, the chart is a powerful tool. It means that once you know a couple of variables, you can calculate the others. This, in turn, means that if you want to change variables, you know what other variables you need to move in what direction in order to get what you want.
You should be able to calculate how many grams of water you need to remove from a space, and therefore how many hours you should work your dehumidifier. Or, on the contrary, if you want a certain RH%, you can decide whether you should turn on the AC or the heating to get it.
Feel free to play with this other calculator and then compare those numbers using this chart. Make up some exercises for yourself and see if you get it right using the charts. Remember my graphs are not precise, so look for rough number similarities to know you are correct. Tip on how to use this calculator: Use 1013.25 millibars for your pressure to keep it standard. Plug in your test numbers on the left and click the Convert button to see your results for wet bulb temperature and RH on the right.
Let's go back to dew point
Remember how I pointed out in the example above that even though you reduced temperature and the RH% dropped accordingly, the theoretical dew point didn't change? This is because the amount of water in the air didn't change. It means that while you were messing around in that imaginary room, nothing else happened to mess with your numbers. This imaginary room is not a real-life situation. In real-life situations, other things happen in your room. For example, leaks, spills, system changes, windows or doors opening, etc.
What does this mean?
This means that when you have a supposedly closed space, your dew points should remain relatively stable and should reflect your temperature readings just like the ones in the graph at the beginning of the article.
However, if you notice a sudden spike or drop which differs completely from the temperature line, then something has happened. Being able to identify this will help you investigate and decide if everything is still okay.
A sudden change in your dew point will indicate a sudden change in the absolute humidity of the air in your space.
Chances are this change can be easily explained.
- Maybe it means someone opened a window and it was really damp/dry outside compared to your room.
- Maybe you got a leaking pipe that is adding water to your room.
- Maybe someone turned on/off a de/humidifier.
- Maybe Cinderella came in and washed all your floors.
I hope this explanation of dew point, humidities and psychrometric charts helps you out wherever you are. I'm not a physicist or HVAC specialist, so do let me know if I didn't explain something quite right, and I will make sure to fix it.
Useful links
- Dew Point Calculator by the Image Permanence Institute
- Image Permanence Institute Guide to Sustainable Preservation Practices for manageing storage environments. See chapter 5 for dew point.
- Gasparetto Engineering
- WOLFRAM Demonstrations Project
If you liked this post, you can follow me on Twitter, check out my newest Instagram experiments or connect with me on Linkedin. You can also sign up for the newsletter below to get my latest articles straight in your inbox.